Monitoring & observability
Prometheus
Time-series monitoring and alerting, the default in cloud-native stacks.
open sourcedesktop
Independent reference — this page is a review. Prometheus is downloaded from the vendor’s official site, not from here.
| Platforms | Linux/Windows/macOS, web UI; CNCF |
|---|---|
| Licence | Open source — Apache-2.0 |
| Price | Free |
| Section | Monitoring & observability |
| Updated | 2026-11-05 |
What it is
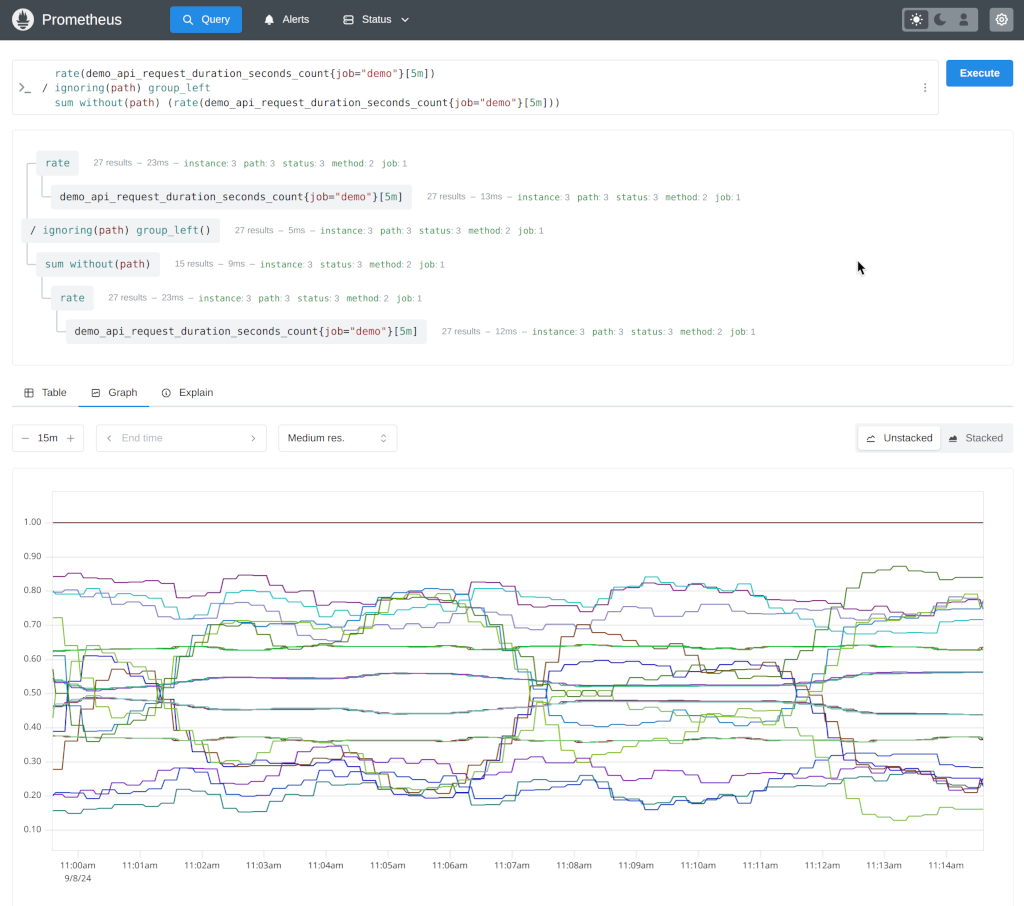
Monitoring, alerting and a time-series database come as one package here. It scrapes HTTP endpoints, stores the metrics, queries them with PromQL and supports flexible alert rules. Containers and Kubernetes have made it the de-facto standard, and most teams run it next to Grafana.
Problems it closes
- You’re running containers or Kubernetes and need metrics built for that environment.
- Your alerting logic needs a query language with real expressive power.
How administrators run it
- Scrape exporters and application /metrics endpoints on a set interval.
- Write PromQL alert rules and hand the dashboards off to Grafana.
Strengths & trade-offs
Strengths
- The standard for cloud-native monitoring.
- PromQL is genuinely powerful.
- The exporter ecosystem is vast.
Trade-offs
- The pull model and long-term storage need planning.
- For visuals you’ll want Grafana alongside it.
Common questions
Do you have to run Grafana with it?
Not strictly, but most teams pair the two for dashboards; Prometheus itself sticks to collection and alerting.
Is it useful outside Kubernetes?
Yes. It shines in container and cloud-native setups, but it’ll scrape any HTTP metrics endpoint.
Alternatives
Grafana Dashboards and visualisation layered over Prometheus, Zabbix, databases and clouds. open sourcecloud + desktop Linux/Windows/macOS/Docker, web; cloud Zabbix Open-source monitoring across servers, network gear, VMs and applications. open sourcedesktop Linux/Unix server, web UI; agents for Windows/Linux/macOS/Unix Datadog Cloud observability for metrics, traces and logs, with nothing to host yourself. paid / trialcloud SaaS (web + mobile); agent for Windows/Linux/macOS